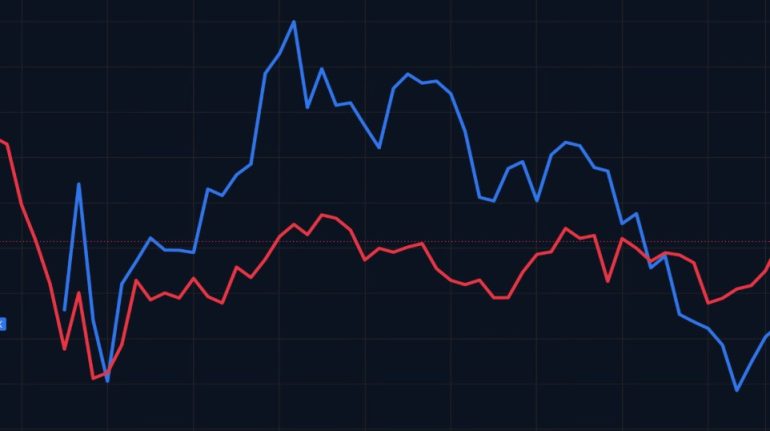
How Does Starting Date Affect S&P 500 Investment Returns?
The starting date of an investment can have a significant effect on the final value of an S&P 500 portfolio, especially over shorter periods. An S&P 500 investment calculator makes it possible to test different starting dates and see how the same
contribution strategy would have performed historically. This can be particularly useful for investors using dollar-cost averaging (DCA), because every monthly or weekly contribution is exposed to the market conditions that existed at that particular time.
The S&P 500 is a market-capitalization-weighted index designed to represent the large-cap segment of the U.S. stock market. S&P Dow Jones Indices currently describes it as an index containing 500 constituent companies, although the exact number of securities can vary because of multiple
share classes and index changes.
But why can two investors who use exactly the same strategy end up with very different results?
The answer starts with one simple variable: when they started investing.
Why Does the Starting Date Matter?
The stock market does not produce the same return every year. Some periods contain strong gains, while others include recessions, corrections, bear markets, or unusually rapid growth.
Imagine two investors:
- Investor A starts investing in January 2000.
- Investor B starts investing in January 2003.
They could contribute exactly the same amount every month and follow the same S&P 500 strategy. However, their results could be very different because their first contributions experience different market conditions.
This is one of the most important limitations of looking at an average annual return.
An average return can describe a long period, but it does not tell you what happened during a particular sequence of years.
For a real investor, the sequence matters.
Starting at a Market Peak vs. Starting During a Decline
One of the clearest examples is what happens when an investor begins shortly before a major market decline.
Suppose you invest $10,000 immediately before the market falls significantly.
Your portfolio could temporarily lose a substantial portion of its value. If you invest a lump sum, the entire $10,000 is exposed to the market from day one.
Now consider a DCA investor who invests $1,000 per month.
If the market falls after the first contribution, later contributions purchase shares at lower prices. This means the investor is buying more shares for the same amount of money.
That does not eliminate investment risk, and it does not guarantee a better result. However, it changes how the investor experiences a market decline.
This is one reason starting dates are particularly interesting when analyzing DCA.
How Dollar-Cost Averaging Changes the Effect of Starting Date
With dollar-cost averaging, you invest a fixed amount at regular intervals rather than investing the entire amount at once.
For example:
| Month | Contribution | Market condition |
|---|---|---|
| January | $500 | High prices |
| February | $500 | Prices decline |
| March | $500 | Prices decline further |
| April | $500 | Market begins recovering |
| May | $500 | Prices increase |
The investor buys at several different prices.
When prices are high, the fixed contribution purchases fewer shares.
When prices are low, the same contribution purchases more shares.
This means the final result depends not only on the starting date but also on what happens during the entire contribution period.
For this reason, two DCA strategies with different starting dates can produce substantially different portfolio values even when the contribution amount and investment duration are identical.
A 10-Year Investment Can Have Very Different Outcomes
Consider two hypothetical investors who each contribute $1,000 per month for 10 years.
Both contribute:
$1,000 × 120 months = $120,000
Their contribution amount is identical.
Their investment period is identical.
Their strategy is identical.
The only difference is the starting date.
Investor A starts during a period of relatively strong market performance.
Investor B starts shortly before a major correction.
Even though both investors contribute $120,000, their ending portfolio values can differ because each contribution experiences a different market path.
This is why historical analysis should use actual dates rather than simply assuming a constant annual return.
The Sequence of Returns Matters
The order in which market returns occur can be extremely important.
Consider two simplified scenarios.
Scenario A
The market experiences:
- Year 1: +20%
- Year 2: +15%
- Year 3: +10%
- Year 4: -10%
- Year 5: +12%
Scenario B
The same returns occur in a different order:
- Year 1: -10%
- Year 2: +12%
- Year 3: +10%
- Year 4: +15%
- Year 5: +20%
The long-term market path is different even though the same annual returns appear in both examples.
For investors making regular contributions, the timing of those returns affects how many shares each contribution purchases and how long each contribution has to compound.
This is another reason why an investment calculator based on historical dates can be more informative than a simple compound-interest calculation.
Why Starting Early Can Matter
Starting earlier gives investments more time to compound.
Investor.gov explains compound growth as earning returns on both the original investment and previous returns. It also notes that starting earlier gives compounding more time to work.
Consider two investors:
Investor A
- Starts at age 25
- Invests $500 per month
- Continues for 30 years
Investor B
- Starts at age 35
- Invests $500 per month
- Continues for 20 years
Investor A contributes:
$500 × 360 = $180,000
Investor B contributes:
$500 × 240 = $120,000
Investor A not only contributes more money but also gives the earlier contributions an additional decade to potentially compound.
The exact result depends on actual investment returns, fees, taxes, dividends, inflation and the chosen investment vehicle.
There is no fixed S&P 500 return that can be guaranteed for a future period. Investor.gov specifically notes that investments do not have a set rate of return.
What Happens If You Start Before a Crash?
This is one of the most common concerns for new investors.
Imagine starting a DCA strategy just before a major market decline.
At first, your portfolio may fall.
That can make the starting date look particularly unfortunate.
However, if you continue investing while prices are lower, your regular contributions purchase additional shares at those lower prices.
When the market eventually recovers, those shares can participate in the recovery.
This doesn’t mean every market decline will be followed by a predictable recovery within a specific timeframe. It simply illustrates why the outcome of a DCA strategy cannot be judged from the first few months alone.
The longer the investment period, the more market cycles may be included in the analysis.
Short-Term Results Are More Sensitive to the Starting Date
The starting date generally has a much more visible effect over short investment periods.
For example, imagine comparing:
- 1-year investments
- 3-year investments
- 10-year investments
- 20-year investments
- 30-year investments
A one-year investment is exposed to a relatively small number of market conditions.
If the investment begins shortly before a correction, the result can look very different from one that begins shortly after the correction.
A 30-year investment contains many more market cycles.
This does not make the starting date irrelevant. Instead, the effect of one particular market event can become smaller relative to the entire investment period.
Why Historical S&P 500 Calculations Are Useful
Historical calculations allow investors to ask questions such as:
- What if I started investing in 2000?
- What if I started in 2005?
- What if I started in 2010?
- What if I started immediately before a major decline?
- What if I started after a market recovery?
- How would $500 per month have performed?
- What if I invested $1,000 per month?
- Would weekly contributions have produced a different result from monthly contributions?
These are much more concrete questions than simply asking:
“What return can I expect from the S&P 500?”
A historical calculator can show how a specific contribution plan behaved during an actual historical period.
Changing the Starting Date in an S&P 500 Calculator
One useful experiment is to keep everything constant except the starting date.
For example, you could use:
Investment amount: $500 per month
Frequency: Monthly
Initial investment: $0
Investment: S&P 500
End date: Today
Then run the calculation multiple times:
- Start in 2000
- Start in 2005
- Start in 2010
- Start in 2015
- Start in 2020
The contribution amount remains exactly the same.
Only the starting date changes.
This makes it easier to see how different historical market environments affected the eventual portfolio value.
Initial Investment Makes Starting Date Even More Important
The effect of the starting date can also change depending on whether you make an initial lump-sum investment.
Compare two strategies.
Strategy A: DCA Only
You invest:
$500 every month
There is no initial investment.
Strategy B: Initial Investment + DCA
You invest:
$20,000 initially
Then:
$500 every month
In Strategy B, a much larger amount is exposed to the market from the beginning.
Therefore, the market level at the starting date can have a greater impact on the portfolio’s early performance.
A starting date immediately before a major market decline would affect the initial $20,000 more directly than it would affect a strategy that starts with only a $500 contribution.
Dividends Also Matter
When analyzing long-term S&P 500 performance, it is important to distinguish between price return and total return.
The S&P 500 has separate price-return and total-return versions. The total-return version incorporates dividends and assumes they are reinvested.
This distinction can become significant over long periods.
For example, a historical calculation using only the price index may produce a different result from one based on total return.
Therefore, when comparing historical investment results, check what type of return data is being used.
Starting Date and Inflation
Another important consideration is inflation.
Suppose an investment grows from $100,000 to $200,000 over a long period.
At first glance, the investor appears to have doubled the money.
But if prices have also increased substantially during that period, the purchasing power of $200,000 is lower than it would have been at the beginning.
This is why it can be useful to look at both:
Nominal return
The investment’s return measured in the original currency without adjusting for inflation.
Real return
The return after accounting for inflation.
An S&P 500 calculator that provides both nominal and inflation-adjusted results can therefore provide a more complete picture of what historical growth actually meant in purchasing-power terms.
Starting Date vs. Contribution Amount
Starting date is only one variable.
You can also change:
- Monthly contribution
- Weekly contribution
- Initial investment
- Investment period
- Currency
- Inflation adjustment
- End date
For example, suppose you compare:
Plan A: $500 per month for 20 years
with:
Plan B: $1,000 per month for 10 years
Both plans involve:
$120,000 of total contributions
But they put money into the market at different times.
Plan A spreads the contributions over a longer period, while Plan B invests twice as much each month over a shorter period.
The historical market path can therefore produce different outcomes.
Should You Try to Pick the “Perfect” Starting Date?
Historical data can make it tempting to search for an ideal entry point.
But knowing the best starting date in advance would require knowing future market movements.
Historical calculations can show what happened after a particular date, but they cannot tell an investor what the next market cycle will look like.
For someone using regular contributions, the practical question may therefore be less about finding the perfect day and more about understanding how different starting dates affected previous investment plans.
This distinction is important:
Historical analysis explains the past. It does not predict the future.
A Simple Way to Study Starting-Date Risk
You can perform a useful historical experiment with five scenarios.
Assume:
- $1,000 initial investment
- $500 monthly contribution
- 10-year investment period
- S&P 500
- Same contribution frequency
Then change only the starting date.
For example:
| Scenario | Starting date | Contribution |
|---|---|---|
| A | 2000 | $500/month |
| B | 2005 | $500/month |
| C | 2010 | $500/month |
| D | 2015 | $500/month |
| E | 2020 | $500/month |
The purpose isn’t to identify a “winning” date.
Instead, the exercise demonstrates how different market environments can influence the same investment strategy.
You can then repeat the experiment with 20-year periods to see how the results change when the investment horizon becomes longer.
Why the Starting Date Is Only One Part of the Story
The starting date can have a major influence on historical results, but it should not be considered in isolation.
Other variables include:
- Investment duration
Longer periods expose the portfolio to more market cycles. - Contribution size
Larger contributions increase the amount of capital exposed to market movements. - Contribution frequency
Weekly and monthly DCA produce slightly different purchase schedules. - Initial investment
A large initial contribution means more capital is invested immediately. - Dividends
Total-return calculations include reinvested dividends, while price-return calculations do not. - Inflation
Nominal growth and real purchasing-power growth can be very different. - Fees and taxes
Historical index calculations generally do not perfectly represent the actual results of a particular investor.
Final Thoughts
The starting date is one of the most important variables when analyzing historical S&P 500 investment returns.
Two investors can use the same contribution amount, the same frequency and the same investment period yet achieve different historical outcomes simply because they began at different points in the market cycle.
For DCA investors, the effect is more complicated than simply looking at the S&P 500 level on the first day. Every subsequent contribution is made at a different market price, so the entire sequence of market movements matters.
The most useful way to study this is to test multiple historical starting dates while keeping the other variables constant.
An S&P 500 investment calculator can make this process much easier. Instead of relying on a single assumed annual return, you can examine how a specific contribution plan would have behaved across different historical periods.
Just remember that historical results are observations, not promises. The S&P 500 has experienced both substantial gains and substantial declines, and future returns can differ from historical results. S&P Dow Jones Indices also distinguishes between actual index history and hypothetical
back-tested data for periods before the S&P 500’s official 1957 launch date.
The starting date matters—but so do the amount invested, the investment horizon, contribution schedule, dividends, inflation and the actual path taken by the market.
That is exactly why comparing several historical scenarios can be more informative than looking at a single historical return number.